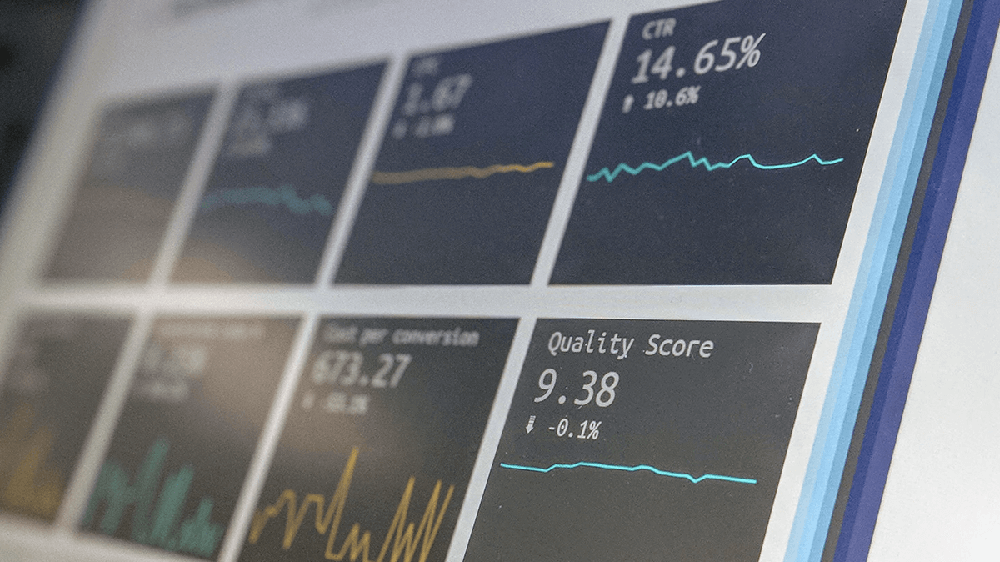
Digital marketers are experiencing an “issue” at the moment. We have a substantial amount of data to analyse and use to our benefit. Definitely not a bad problem to have, as you would much rather have too much data than not enough.
Taking Google Analytics as an example, GA has a staggering 150 default metrics, which can be viewed through over 100 various dimensions. That is just the default settings, and does not include any advanced views, filters or implementations you may well want to setup.
Looking at social media, Facebook analytics exports a whopping seven spreadsheets with over ten columns of data, while Twitter analytics exports include up to forty columns of data.
That’s a lot of data to sift through! This can make it exceptionally difficult to choose one, or even a few, KPIs to really focus on.
You would think having access to such a wide range of data would make our marketing strategies easier, and this is generally true for larger companies who are able to outsource their data analysis to data science experts. These companies have indeed prospered, but the smaller businesses tend to struggle with where to start with this seemingly insurmountable mound of data.
In smaller businesses, resources tend to be much tighter and the luxury of spare time is sparse. The result of this is that employees don’t tend to digest the data, explore trends and ask questions. Instead, employees get into a routine of running the same reports over and over on a monthly basis, while not gaining much insight into what value the data at hand provides.
This is more common than not among small businesses, but there are steps and mindset changes one can take on to streamline your data reporting, to allow you more time to be inquisitive and find the value needed for your marketing strategies.
Marketing analytics is not rocket science, so don’t treat it as such.
Take A/B testing, also known as split-run testing, for example. It’s been around for what feels like decades now!
Have some ideas on how to improve your email? Go ahead and test it using various test buckets. Looks like our audience prefer our teal button more than our yellow button, great! How about our landing pages? Can we AB test our hero banner? Sure, why not. Let’s nail down what our audience responds best to.
Does A/B testing really represent how your customers respond generally, or just in that current moment they received your content? It’s difficult to tell and is why A/B testing can be so frustrating at times.
The results of the tests can often be inconclusive. Sometimes your test sample is too small to have a statistical weight behind it to make these difficult decisions. Other times, there are factors which are out of your control, that might influence your results, like a website loading speed issue.
The point here, is that A/B testing, or any other form of testing, may not yield the results for what works best from a marketing perspective. Having a controlled environment, like any scientific test, is paramount to obtaining an accurate depiction of your results. However, in Digital Marketing, controlled environments are few and far between.
These methods should not be discarded by any means, but we also need to be cautious when implementing them, because again, marketing is anything but a controlled environment.
Some metrics matter, others don’t.
Now back to those ridiculously large social media analytic reports. Here’s the honest truth: I rarely use even 50% of those metrics. Why?
Well, to begin with, it’s important you know what you are gaining value from when looking at these reports. Many metrics are just slight variations of themselves, or sometimes have very convoluted definitions as to what those metrics are. If they are too similar, or too vague I omit them from my report.
The fear of missing out is the real crux of the issue here. FOMO again.
Reporting on every metric available, due to fear of missing out on something, isn’t the best strategy, because it clouds the real valuable metrics. If a metric isn’t valuable, don’t use it, as it’s only going to make it more difficult for you to spot relevant trends in your data.
Just keep in mind that platforms like Google, Facebook, LinkedIn and Twitter, although they provide you with endless amounts of data to sift through, only you and your business can know what’s really important.
It’s about the ingredients, not the meal.
Before you start cooking up an analytics report, think about the value you are hoping to find in the data. Play devil’s advocate and ask yourself what results you would expect to see if your initial conclusions were wrong.
In doing this, you’ll be much better suited to finding patterns and trends you may not have spotted with your initial conclusion-based approach.
Stop searching for the right answers, and look for the right questions
Question yourself, your approach and your data regularly. If you feel you’re eventually questioning everything, don’t be overwhelmed. You’re doing it right.
The world is changing constantly, along with the platforms we use and HOW we use them. Your perceived concept of the “right answers” may be true one day, and wrong the next.
Keep adapting and be open to change.
If there’s one lesson I’ve learned working with digital marketing data, it’s that you have to be a perpetual sceptic. Of the metrics, of your reporting, of yourself.


